
Munro: NL OPS leader Votto understands OPS and all it entails
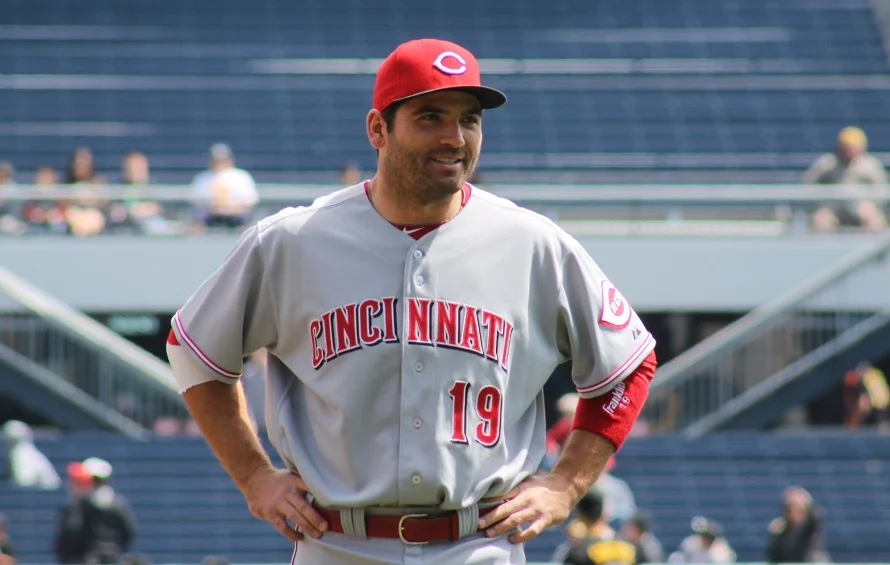
Etobicoke, Ont., native Joey Votto boasts a career OPS that ranks among baseball's all-time greats.
On-Base Percentage Plus Slugging (OPS)
By Neil Munro
Canadian Baseball Network
Baseball analysts and general managers (not to mention the player agents) have been looking for that one simple statistic that can be used to conclusively quantify the true value of a baseball batter in contributing to his team’s overall run production. Interestingly enough, many different baseball statistics have been espoused as the ultimate measure of batting proficiency over the last century.
For several decades, that supreme statistic was the batting average. The best hitter in baseball was the batting champion – period. The idea of batting .300 or better yet batting .400 has even entered the lexicon in reference to signifying success for any number of situations that had no relationship at all to baseball. There can be no doubt the player that had the greatest effect on changing the idea that the batting average represented baseball’s definitive pinnacle of success was Babe Ruth. His devastation of home records (as well as all other slugging achievements) caused a sensation among the fans and served as the inspiration for generations of would-be future ballplayer superstars. Baseball publications and sportswriters began using the slugging percentage (which takes the number of extra bases hit into effect) as being a superior measure of batting proficiency than the straight batting average (which counts singles as being equal to home runs). Slugging percentage is calculated as the quotient of total bases and official at bats.
Interestingly enough, the National League first listed the slugging percentage (SP or as the more recognizable SLG in use today) as an official statistic for the first time in releasing its 1924 player records. Despite the fact that Babe Ruth would dominate all players in slugging (and that Lou Gehrig, Jimmie Foxx and Ted Williams all compiled impressive slugging performances that really outdid those of their National League counterparts) the American League only listed this category of batting for the first time in releasing its 1945 records. Baseball purists always lamented the fact that high scoring games and the emphasis on the long ball was hurting “inside baseball” in which pitching and scraping out one run at a time formed the basis for the best pure features of the game.
And so, the batting champion of each league continued to be recognized by some baseball authorities as the best hitter for decades to come. To illustrate this point, Ty Cobb was consistently acknowledged as the greatest player of all time in virtually every poll or ranking survey conducted up until at least the 1950s. The evidence was clearly that Cobb’s career leading batting average of .367 easily outdistanced Ruth’s .342 mark. (Historical research has since revised Cobb’s average downward to .366.) On the first ballot for selecting the inaugural members of the National Baseball Hall of Fame in 1936, Cobb was the leading vote getter (named on 98% of the votes cast) while the Babe would have to settle for a second place tie with Honus Wagner (each garnering 95% of the votes).
Eventually, and probably assisted by the fact that more elaborate analysis of batting statistics were made possible by the use of computers, the realization that the on-base average and slugging percentage correlated with increased run production to a far greater extent than did the batting average took hold. This led most baseball writers and historians to select Babe Ruth as the greatest player ever in polls taken after 1960. Cobb’s fans lamented that they could not understand exactly what batting accomplishments the Babe could possibly have managed to achieve 25 years after his retirement, to knock Cobb out of his previous exalted perch as the No. 1 man.
During the decades between 1960 and 1990, baseball analysts (amateurs to begin with but later championed by many of the most successful managers in baseball) devised analytical studies that repeatedly indicated that the two basic cornerstones of added run production were getting on base frequently (specifically not making outs) and driving the ball for power (especially connecting for extra base hits). Unofficial lists of the on-base percentage (OBP; sometimes referred to as the OBA as this statistic is not really presented as a true percentage) appeared more frequently in publications and newspapers. Specifically, OBP records the ratio of the batter's times-on-base (TOB – the sum of hits, walks, and times hit by pitch) to their number of plate appearances. The OBP first became an official MLB statistic in 1984. By factoring in only hits, walks and times hit by pitch, OBP does not credit the batter for reaching base due to fielding errors or times when the batter reaches safely on a fielder’s choice, or dropped third strikes, etc.
Initially, the exact OBP computation in use varied somewhat, particularly in terms of the treatment of sacrifices. Today, sacrifice bunts (SH) are not counted in the plate appearances denominator, while sacrifice flies (SF) are counted. Presumably the thinking is that a batter truly sacrifices a batting appearance when laying down a bunt to advance a teammate while the hitter is actually trying for a home run when he hits a long run-producing fly ball out.
For several decades, the OBP was considered to be perhaps the most important statistic used for evaluating batters’ offensive contributions. Baseball fans will recall the extent to which the Oakland A’s general manager Billy Beane championed the OBP in evaluating players in the movie Moneyball (with Brad Pitt in the role of Beane). Ted Williams was often heard to say that his fondest wish would be for him to walk down a street and hear passersby observe “There goes Ted Williams, the greatest hitter who ever lived.” (This is really the sanitized version of his actual quote.) Since Williams finished with an all-time best OBP of .482 compared to runner-up Ruth’s .474, it goes without saying that Beane would have conceded Williams’ fondest wish.
It would be just a matter of time until the analysts found different ways to combine the on-base percentage with the slugging percentage in recognizing the combined contribution of these two attributes. From my own conversations with the early baseball analytical icons like Bill James and Pete Palmer, I believe that Dick Cramer, one of the co-founders of STATS, Inc., the baseball statistics and information company, was the first to publish an article featuring a combination of the OBP and SLG. Cramer, a chemist by trade, used the product of these two basic percentage statistics and called it the batters’ run average. His 1977 article in the Baseball Research Journal about clutch hitting is often cited as one of the most influential ever written to this day.
The OPS statistic (OBP plus SLG) was first published in 1984 by John Thorn and Pete Palmer's book, The Hidden Game of Baseball. The New York Times then began listing the leaders in this statistic in its weekly features on the more elaborate baseball statistics as early as 1985. Baseball writer Peter Gammons used and preached of the importance of the OBP statistic, and other writers and broadcasters soon picked it up. The popularity of OPS gradually spread, and by 2004 it began appearing on Topps baseball cards. OPS actually appeared on the scene in the late 1970s, with on-base and slugging percentages being added rather than multiplied (even though most everyone agrees that multiplication has a higher correlation). Presumably this is largely due to the fact that the sum was simpler to work with. As well, the standard for excellence in this regard is the nice round figure of 1.000 (for example achieved via a .415 OBP and a .585 SLG). The comparative figure formed by the product of OBP and SLG (.242775) certainly does not evoke the same degree of excellence as 1.000. Still, many “sophisticated” baseball researchers disdain the popular use of OPS today because it treats OBP as equal in value with SLG, while OBP is nearly twice as important as SLG in terms of its effect on increasing run production.
The truth is that a wide variety of very complex formulas do exist nowadays that compute a batter’s contribution to amassing runs scored that are significantly more accurate than the OPS. One such method that can be used is on-base plus slugging PLUS (OPS+). Because of the complexity in calculating OPS+, it has not gained widespread popularity. This statistic normalizes a player’s OPS – it adjusts for other variables that also have an effect on raw OPS scores (e.g. ball park characteristics) and puts the statistic on an easy-to-understand scale. A 100 OPS+ score is arbitrarily set as the league average, and hence each point up or down is one percentage point above or below league average. Since OPS+ adjusts for league batting and ballpark effects, it is possible to use OPS+ to compare players from different eras and on different teams.
However, these more elaborate mathematical machinations require the use of a spreadsheet and hours of data entry to formulate and appreciate their outcomes, so OPS remains the favourite stat to this day as the ultimate, yet simple, method for comparing baseball offensive contributions in a nutshell. Many different OPS scales are quoted for comparing player batting proficiency. Here is one standard for the quality of the accomplishments for OPS:
The major league average for all batters in OPS last season was .739. Remember that these arbitrary rankings just represent batting contributions and make no consideration of base running or fielding. In most cases, the players performing at the most important defensive positions are more properly valued for their fielding skills in contributing to team victories than for their hitting.
While conceding that better statistical analysis tools can be utilized, let’s see which OPS feats rate as the best of all time. Four players dominate the list of season and career-best performances in this category – Babe Ruth, Barry Bonds, Ted Williams and Lou Gehrig. Keep in mind that the calculation of times at bat used for both the OBP and SLG has varied to some extent over time. This is particularly true with regard to the recording of sacrifices. For example, Babe Ruth’s final 1930 batting line lists him as having contributed 21 SH, while in the following year he has exactly zero for this category. From 1926 to 1930, a batter was given credit for making a SH for a fly ball out that allowed a base runner to advance to any base and not just a run-scoring out. In 1931, the official definition changed so that a SH was awarded only for the traditional sacrifice bunt that we are familiar with today. So Ruth’s official OPS for 1930 (1.225 based on a .493 OBP and a .732 SLG) would be reduced to a “mere” 1.181 OPS the way we measure these categories at this time. You can be sure that the Bambino was never going up to the plate and even thinking about laying down a bunt. It was just the definition of what constituted a SH at the time that accounts for the difference from 1930 to 1931.
Ruth, Bonds and Gehrig (in several of his most productive seasons) had a statistical advantage over Ted Williams in that their run-scoring fly ball outs were not counted as at bats in calculating their slugging percentages while these were counted as at bats for most of Ted Williams best years. Overall, the rankings would not change too much, even using a level playing field for calculation purposes.
A much greater effect on OPS calculations results from the era in which the batter performed and from his good fortune in playing in a ballpark beneficial in enhancing batting statistics. Willie Mays and Hank Aaron do not appear on any of the leaders’ lists below because their batting performances were comparatively reduced as a result of playing in ballparks favouring pitchers and playing at a time when run production was relatively low. For example, in the 2000 baseball season, all major league teams combined for an average of 5.14 runs per game. In 1968, the average number of runs per game was just 3.48. In 1930 the figure was 5.55 runs/game, while in 1894 the figure was an almost astronomical 7.38 (about double the average level of run production of many seasons during the 1960s). With a cautioning note of the limitations described above, several lists of the all-time leaders in OPS follow below.
Here are the 2017 leaders in each league as of the All-Star Game break:
National 2017 OPS Leaders
American League 2017 OPS Leaders
A special mention should be made about two additional players here. Neither Mike Trout nor Freddie Freeman has compiled enough plate appearances to be listed among the league leaders as a result of their lost time from injuries. Freeman has just returned to action in the last few days while Trout is expected back after the break. It remains somewhat doubtful whether either of them will accumulate enough plate appearances to qualify for the league OPS titles, even if their totals are still the best in their respective leagues come October. A total of 502 plate appearances are required to qualify for any percent leadership title. There remains a possible exception to this rule however, as described about Joey Votto’s 2012 performance in one of the tables presented later in this article.
*PA represents their respective number of plate appearances as of the All-Star break.
The best season OPS accomplishments in baseball history are given in the lists below. All statistics are counted through July 9, 2017 for active ballplayers.
All-Time Single Season Leaders in OPS
American League
National League
Best Nineteenth Century OPS Seasons
The best OPS season records by Canadian ball players are outline below. To date, O’Neill, Walker and Votto are the only Canadians to have led their league in OPS in at least one season. Walker dominates this list with six of the best ten seasons registered to date.
All-Time Single Season Leaders in OPS Among Canadians
A few special cases should be mentioned here as well. Four Canadian batters had seasons that would easily rank among our best ever achieved but they failed to get enough official at bats to qualify for consideration because of injuries.
In 2012, Votto had insufficient plate appearances to qualify for the N.L. leadership in the percentage categories, but was named the OBP N.L. leader when rule 10.22 was applied. This rule states: Notwithstanding the foregoing requirement of minimum appearances at the plate, any player with fewer than the required number of plate appearances whose average would be the highest, if he were charged with the required number of plate appearances shall be awarded the batting, slugging or on-base percentage championship, as the case may be. Because of injuries, Votto had just 475 official plate appearances that year, but when 27 “phantom” hitless at bats are added, his revised .448 OBP still was better than runner-up Buster Posey’s .408 mark, so Votto was recognized as the 2012 OBP leader. He also had the best OPS figure in the N.L. in 2012 but the application of rule 10.22 left him short of the recognized league leader (Ryan Braun at .987).
Justin Morneau was tearing up the league in 2010, leading all American League batters in several statistical categories, including OBP and SLG after his first 81 games played. Unfortunately he suffered a concussion on July 7 that year and missed the rest of the season. He had been voted as the starting A.L. first baseman for the American League All-Star team.
Jeff Heath was among the 1948 National League leaders in a couple of batting categories when a broken leg (suffered as he attempted to slide into home plate in a game in September) prematurely ended his season. He missed the rest of the 1948 season and also missed out on what would have been his only World Series appearance. George Selkirk’s best year in terms of percentage statistics at least was 1937, but a broken collarbone sidelined him for almost half of that season.
Additional Significant Single Seasons By Canadians
The career OPS leaders (both for all-time and among Canadians) round out the tables presented here.
All-Time Career Leaders in OPS
Canadian Career Leaders in OPS
Votto continues to excel as a slugger, posting up batting statistics that rank among the best ever achieved by any Canadian. At the All-Star break, he led all National League batters in home runs (tied with 26), slugging percentage (.631) and OPS (1.058) as well as most of the more complex analysis stats such as runs created. Just for good measure; he also had the best fielding percentage among first basemen and led all major league first sackers in assists. He should have been the N.L. starting first baseman in the All-Star Game (he placed fifth in the vote) but Cincinnati is a small market club with limited fan support for their losing team right now. Hopefully, Canadian baseball fans will remember him next year when filling out their choices for the National League All-Stars when they mark their ballots in ticking off the names of their Blue Jays favourites for the American League squad.