
Comparing 1993 Jays offence to 2015 Jays offence
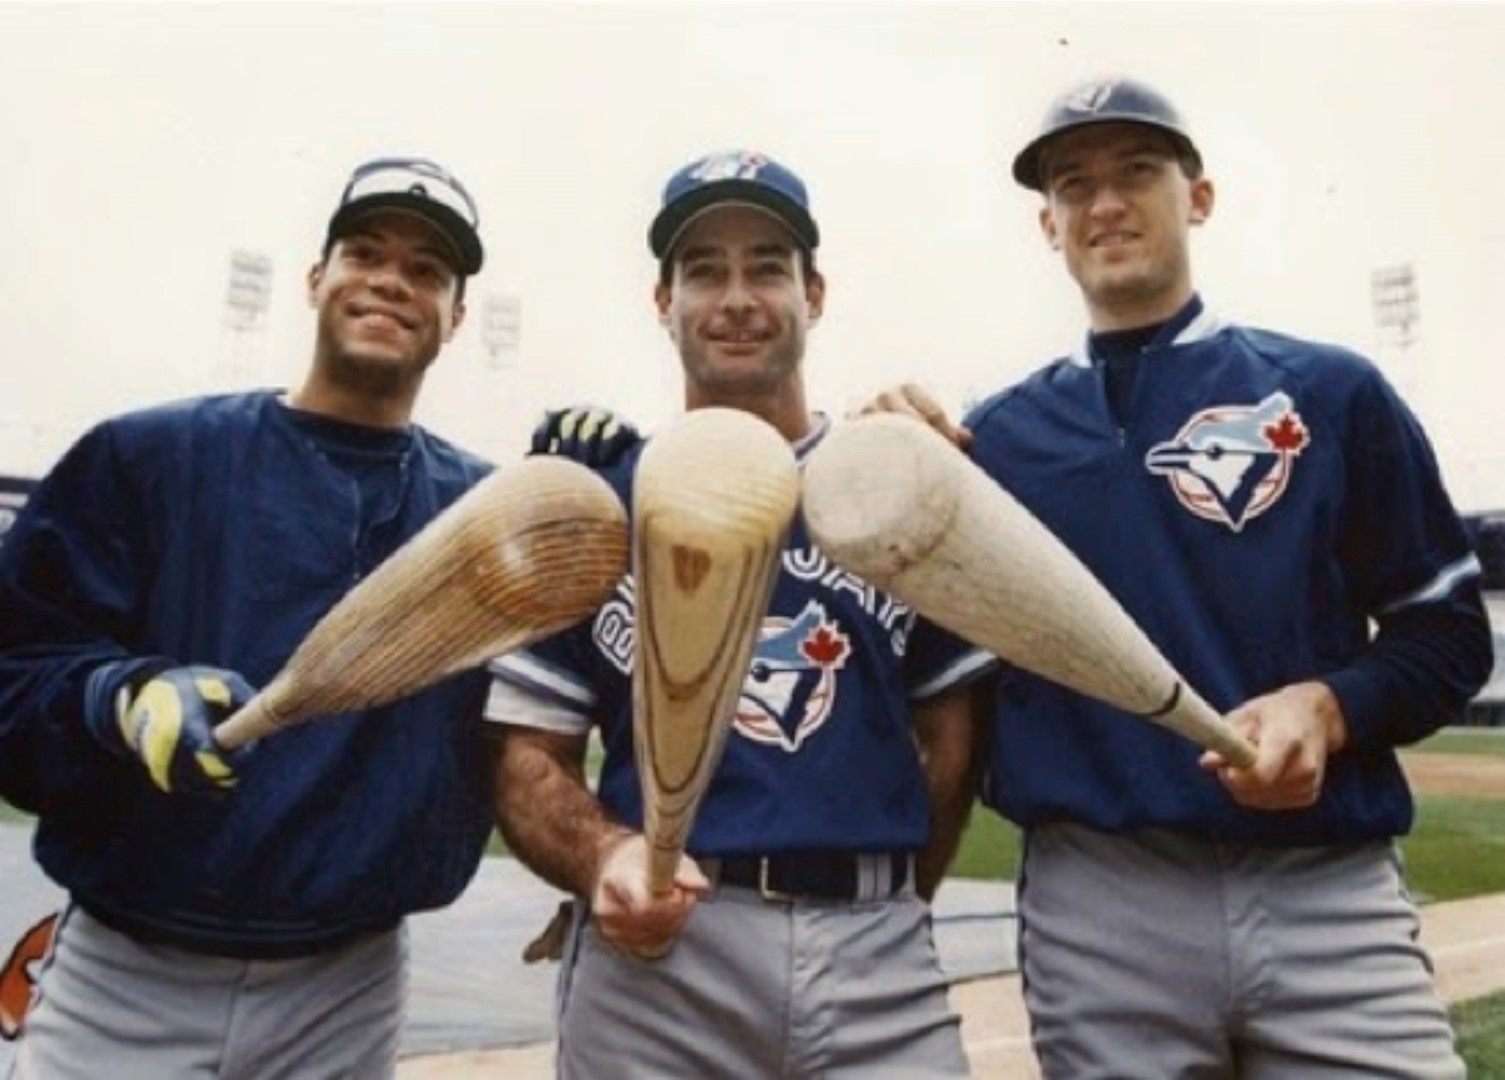
Hal of Famers Robbie Alomar and Paul Molitor finished . behind teammate John Olerud in the 1993 AL batting race. The 1993 Blue Jays ran the bases and hit for average and the 2015 Jays mashed. The better offensive team?.
By Bob Elliott
So which is the better offensive team?
The 1993 World Series champions who had a batting champ (John Olerud) and three inductees into the Hall of Fame in Cooperstown (Ricky Henderson, Robbie Alomar and Paul Molitor)?
Or Brook Jacoby’s Bombers with seven sluggers with 10 or more homers (Josh Donaldson, Jose Bautista, Edwin Encarnacion, Russell Martin, Troy Tulowitzki, Chris Colabello and Justin Smoak)?
“This one’s better,” said Alomar from Manhattan after the Blue Jays blanked the New York Yankees 6-0 Saturday afternoon moving to 2 1/2 games of first place in the American League East.
Really?
“Yep, we’re not playing any more, the 1993 team is all retired,” said Alomar, owner of quick hands, quick feet, quick hands and on Saturday a quick wit.
The memory bank might have memories of Joe Carter slugging, Devon White lining balls into the gap, Olerud winning the batting title, followed by Molitor and Alomar, plus Henderson starting the game-winning rally in Game 6 of the World Series.
Yet, the numbers show for the 1993 season show that the Jays led the AL in Runs per game slugging (.436) while scoring 5.23 runs per game, when the league average was 4.71 and the average ERA was 4.32. The Detroit Tigers score more runs than the Jays in 1993.
While that team had more HOFers, this year’s Jays has more depth leading in on-base (.333), slugging (.446) and OPS (.779) while scoring an average of 5.31 runs per game. The average runs per game mark is 4.27 while the League ERA is 3.92.
So, this team is scoring more than the league average in an era when they are facing better pitching.
“This lineup has more power than we did,” said Pat Hentgen from Shelby Township, Mich. “but White, Alomar, Molitor and Henderson had better speed. The base running advantage would go to the older team.
“Both teams have real deep lineups. We had Ed Sprague who became a 20-homer guy hitting eighth. This year’s team has a great hitter in Kevin Pillar eighth. This team is intimidating for an opposing pitcher, explosive.”
The top five spots in the 1993 lineup batted a collective .297 (best in the majors that year) and slugged .480 (second to the San Francisco Giants .482), with 112 home runs (fifth in majors).
This season, coming into Saturday afternoon, the Jays’ top five was batting .261 (19th in majors) and slugging .469 (tops in the majors), with 106 home runs (also tops in the majors).
Each top five contains a key addition at the deadline:
The team that beat the Chicago White Sox and then the Philadelphia Phillies in post-season play had Rickey Henderson, acquired from the Oakland A’s, White, Molitor, Carter and Olerud ... with Alomar hitting sixth.
This group has Tulowitzki, who general manager Alex Anthopoulos acquired from the Colorado Rockies, leading off, followed by Donaldson, Bautista, Encarnacion and either Colabello or Smoak ... with Martin hitting sixth.
After 112 games Martin has a better OPS than Pat Borders, Bautista beats Carter in right, Donaldson over Sprague, Pillar over White in centre and Tulowitzki over Fernandez at short. The team with the rings wins with Olerud at first, Alomar at second and Molitor at DH.
“This is more of a power house, our lineup we could produce runs, but this is more powerful,” Alomar said. “Alex has done what we needed to be done, he knew that when there is a time to go, you go for it go for it. Those chances don’t always come twice.
“I feel honored he gave me a shout to ask about a couple of things. Adding these players ... this is what everyone wanted.”
The most productive position in the 1993 lineup was the No. 5 spot where Olerud batted .350 with a 1.019 OPS, where as this year it is the No. 2 hole where Donaldson has hit .299 with a .974 OPS.
Besides Donaldson’s spot, this year’s team has an advantage at the Nos. 7-thru-9 spots.
“I respect both teams,” said Alomar as the Yellow cabs honked in the background on a Saturday in New York “this team has a chance to do things we did in 1992-93.”
We can compare offences from now until Game 162.
But there is no comparing the post-seasons ... not yet anyway.
1993
AL average Blue Jays
Runs per game 4.71 5.23
Average .267 .279
Homers 148 159
On-base mark .337 .350
Slugging .408 .436*
OPS .745 .780
(League ERA average 4.32)
2015
AL average Blue Jays
Runs per game 4.27 5.31
Average .254 .264
Homers 114 149
On-base .315 .333*
Slugging .406 .446*
OPS .721 .779*
(League ERA average 3.92)
(* Denotes either led league or leading league)
Production throughout the batting order
1993 Avg. OPS 2015 Avg. OPS
1. .264 .774 .262 .709
2. .282 .792 .299 .974
3. .337 .918 .240 .869
4. .257 .819 .248 .778
5. .350 1.019 .253 .694
6. .282 .787 .272 .787
7. .258 .694 .256 .713
8. .244 .641 .283 .788
9. .236 .664 .263 .679
2015 Toronto Blue Jays Batting vs. 1993 Blue Jays Batting
2015 Statistics Through First 112 games (AL Average runs per game average: 4.265) == Stats provided by Neil Munro, Gerry Fraley.
| Pos | Name | Age | G | PA | AB | R | H | TB | 2B | 3B | HR | RBI | SB | CS | BB | IBB | SO | BA | OBP | SLG | OPS | GDP | HBP | SH | SF |
|---|---|---|---|---|---|---|---|---|---|---|---|---|---|---|---|---|---|---|---|---|---|---|---|---|---|
| C | Russell Martin | 32 | 95 | 377 | 330 | 58 | 84 | 152 | 19 | 2 | 15 | 50 | 4 | 4 | 36 | 74 | .255 | .337 | .461 | .797 | 14 | 7 | 4 | ||
| 1B | Justin Smoak | 28 | 88 | 200 | 180 | 26 | 41 | 81 | 8 | 1 | 10 | 35 | 20 | 55 | .228 | .305 | .450 | .755 | 9 | ||||||
| 2B | Devon Travis | 24 | 62 | 239 | 217 | 38 | 66 | 108 | 18 | 8 | 35 | 3 | 1 | 18 | 43 | .304 | .361 | .498 | .859 | 4 | 2 | 1 | |||
| SS | Jose Reyes | 32 | 69 | 311 | 288 | 36 | 82 | 111 | 17 | 4 | 34 | 16 | 2 | 17 | 38 | .285 | .322 | .385 | .708 | 3 | 4 | 2 | |||
| 3B | Josh Donaldson | 29 | 110 | 490 | 435 | 81 | 128 | 248 | 30 | 30 | 82 | 4 | 45 | 96 | .294 | .363 | .570 | .933 | 11 | 5 | 1 | 5 | |||
| LF | Chris Colabello | 31 | 69 | 261 | 242 | 40 | 77 | 120 | 13 | 10 | 41 | 2 | 16 | 64 | .318 | .360 | .496 | .856 | 9 | 1 | 2 | ||||
| CF | Kevin Pillar | 26 | 111 | 438 | 408 | 53 | 107 | 152 | 20 | 2 | 7 | 39 | 15 | 3 | 21 | 1 | 62 | .262 | .300 | .373 | .672 | 5 | 2 | 4 | 3 |
| RF | Jose Bautista | 34 | 105 | 453 | 371 | 72 | 88 | 187 | 20 | 2 | 25 | 77 | 5 | 2 | 71 | 2 | 69 | .237 | .360 | .504 | .864 | 14 | 4 | 7 | |
| DH | Edwin Encarnacion | 32 | 104 | 439 | 375 | 59 | 94 | 178 | 21 | 21 | 64 | 1 | 2 | 55 | 2 | 74 | .251 | .348 | .475 | .822 | 11 | 4 | 6 | ||
| MI | Ryan Goins | 27 | 82 | 260 | 230 | 28 | 53 | 75 | 9 | 2 | 3 | 27 | 1 | 20 | 48 | .230 | .291 | .326 | .617 | 7 | 1 | 6 | 3 | ||
| LF | Danny Valencia | 30 | 58 | 173 | 162 | 26 | 48 | 82 | 13 | 7 | 29 | 2 | 1 | 9 | 40 | .296 | .331 | .506 | .838 | 4 | 1 | 1 | |||
| OF | Ezequiel Carrera | 28 | 70 | 164 | 147 | 23 | 41 | 55 | 5 | 3 | 21 | 2 | 1 | 9 | 36 | .279 | .327 | .374 | .701 | 1 | 2 | 5 | 1 | ||
| UT | Dioner Navarro | 31 | 37 | 130 | 115 | 12 | 26 | 40 | 5 | 3 | 17 | 11 | 1 | 20 | .226 | .285 | .348 | .632 | 4 | ||||||
| CF | Dalton Pompey | 22 | 23 | 91 | 83 | 10 | 16 | 28 | 6 | 2 | 6 | 2 | 6 | 22 | .193 | .264 | .337 | .601 | 2 | ||||||
| UT | Steven Tolleson | 31 | 19 | 45 | 41 | 9 | 11 | 18 | 5 | 1 | 3 | 2 | 4 | 9 | .268 | .333 | .439 | .772 | 1 | ||||||
| SS | Troy Tulowitzki | 30 | 11 | 49 | 42 | 12 | 11 | 22 | 2 | 3 | 6 | 1 | 5 | 9 | .262 | .367 | .524 | .891 | 2 | ||||||
| Team Totals | 112 | 4257 | 3783 | 595 | 997 | 1685 | 215 | 10 | 151 | 574 | 59 | 18 | 375 | 6 | 775 | .264 | .332 | .445 | .777 | 96 | 31 | 25 | 40 |
2015 Projected Blue Jays Season Ending Stats
| Pos | Name | Age | G | PA | AB | R | H | TB | 2B | 3B | HR | RBI | SB | CS | BB | IBB | SO | BA | OBP | SLG | OPS | GDP | HBP | SH | SF |
|---|---|---|---|---|---|---|---|---|---|---|---|---|---|---|---|---|---|---|---|---|---|---|---|---|---|
| C | Russell Martin | 32 | 137 | 545 | 4776 | 84 | 122 | 222 | 28 | 3 | 22 | 72 | 6 | 6 | 52 | 107 | .255 | .336 | .464 | .801 | 20 | 10 | 6 | ||
| 1B | Justin Smoak | 28 | 127 | 289 | 260 | 38 | 59 | 118 | 12 | 1 | 15 | 51 | 29 | 80 | .227 | .304 | .454 | .758 | 13 | ||||||
| 2B | Devon Travis | 24 | 81 | 311 | 282 | 49 | 86 | 139 | 23 | 10 | 45 | 4 | 1 | 23 | 56 | .305 | .362 | .493 | .855 | 5 | 3 | 1 | |||
| SS | Jose Reyes | 32 | 69 | 311 | 288 | 36 | 82 | 111 | 17 | 4 | 34 | 16 | 2 | 17 | 38 | .285 | .322 | .385 | .708 | 3 | 4 | 2 | |||
| 3B | Josh Donaldson | 29 | 159 | 709 | 629 | 117 | 185 | 357 | 43 | 43 | 119 | 6 | 65 | 139 | .294 | .363 | .568 | .931 | 16 | 7 | 1 | 7 | |||
| LF | Chris Colabello | 31 | 100 | 378 | 350 | 60 | 111 | 175 | 19 | 15 | 59 | 3 | 23 | 93 | .317 | .358 | .500 | .858 | 13 | 1 | 3 | ||||
| CF | Kevin Pillar | 26 | 161 | 634 | 590 | 77 | 155 | 220 | 29 | 3 | 10 | 56 | 22 | 4 | 30 | 1 | 90 | .263 | .300 | .373 | .673 | 7 | 3 | 6 | 4 |
| RF | Jose Bautista | 34 | 152 | 655 | 537 | 104 | 129 | 272 | 29 | 3 | 36 | 111 | 7 | 3 | 103 | 4 | 100 | .240 | .363 | .507 | .869 | 20 | 6 | 10 | |
| DH | Edwin Encarnacion | 32 | 150 | 635 | 542 | 85 | 136 | 256 | 30 | 30 | 93 | 1 | 3 | 80 | 3 | 107 | .251 | .349 | .472 | .821 | 16 | 6 | 9 | ||
| MI | Ryan Goins | 27 | 119 | 376 | 333 | 41 | 77 | 108 | 13 | 3 | 4 | 39 | 1 | 29 | 69 | .231 | .293 | .324 | .618 | 10 | 2 | 9 | 4 | ||
| LF | Danny Valencia | 30 | 58 | 173 | 162 | 26 | 48 | 82 | 13 | 7 | 29 | 2 | 1 | 9 | 40 | .296 | .331 | .506 | .838 | 4 | 1 | 1 | |||
| OF | Ezequiel Carrera | 28 | 70 | 164 | 147 | 23 | 41 | 55 | 5 | 3 | 21 | 2 | 1 | 9 | 36 | .279 | .327 | .374 | .701 | 1 | 2 | 5 | 1 | ||
| UT | Dioner Navarro | 31 | 54 | 188 | 166 | 17 | 38 | 57 | 7 | 4 | 25 | 16 | 1 | 29 | .229 | .287 | .343 | .631 | 6 | ||||||
| CF | Dalton Pompey | 22 | 33 | 132 | 120 | 15 | 23 | 41 | 9 | 3 | 9 | 3 | 9 | 32 | .192 | .265 | .342 | .607 | 3 | ||||||
| UT | Steven Tolleson | 31 | 19 | 45 | 41 | 9 | 11 | 18 | 5 | 1 | 3 | 2 | 4 | 9 | .268 | .333 | .439 | .772 | 1 | ||||||
| SS | Troy Tulowitzki | 30 | 59 | 247 | 222 | 46 | 64 | 109 | 12 | 11 | 33 | 1 | 19 | 1 | 49 | .288 | .351 | .491 | .842 | 6 | 3 | 1 | |||
| Projected Team Totals | 162 | 6157 | 5472 | 861 | 1442 | 2437 | 311 | 14 | 218 | 830 | 85 | 26 | 542 | 9 | 1121 | .264 | .332 | .445 | .777 | 139 | 45 | 36 | 58 |
1993 Statistics Through First 112 games (AL Average runs per game average: 4.706)
| Pos | Name | Age | G | PA | AB | R | H | TB | 2B | 3B | HR | RBI | SB | CS | BB | IBB | SO | BA | OBP | SLG | OPS | GDP | HBP | SH | SF |
|---|---|---|---|---|---|---|---|---|---|---|---|---|---|---|---|---|---|---|---|---|---|---|---|---|---|
| C | Pat Borders | 30 | 96 | 360 | 340 | 28 | 83 | 122 | 18 | 7 | 37 | 2 | 10 | 44 | .244 | .268 | .359 | .626 | 10 | 2 | 5 | 3 | |||
| 1B | John Olerud | 24 | 110 | 473 | 385 | 71 | 151 | 255 | 42 | 1 | 20 | 86 | 1 | 78 | 27 | 44 | .392 | .493 | .662 | 1.155 | 8 | 4 | 6 | ||
| 2B | Roberto Alomar | 25 | 107 | 479 | 421 | 81 | 134 | 196 | 21 | 4 | 11 | 58 | 36 | 14 | 50 | 4 | 53 | .318 | .392 | .466 | .858 | 11 | 3 | 2 | 3 |
| SS | Tony Fernandez | 31 | 97 | 412 | 361 | 42 | 97 | 141 | 16 | 8 | 4 | 44 | 14 | 5 | 42 | 31 | .269 | .345 | .391 | .735 | 14 | 1 | 6 | 2 | |
| 3B | Ed Sprague | 25 | 105 | 422 | 388 | 38 | 97 | 149 | 20 | 1 | 10 | 51 | 20 | 1 | 71 | .250 | .297 | .384 | .681 | 17 | 8 | 1 | 5 | ||
| LF | Rickey Henderson | 34 | 5 | 24 | 20 | 4 | 6 | 8 | 1 | 2 | 1 | 3 | 1 | .300 | .375 | .400 | .775 | 1 | |||||||
| CF | Devon White | 30 | 101 | 460 | 415 | 85 | 114 | 192 | 30 | 6 | 12 | 37 | 24 | 3 | 36 | 1 | 85 | .275 | .343 | .463 | .805 | 1 | 7 | 2 | |
| RF | Joe Carter | 33 | 108 | 461 | 418 | 64 | 105 | 200 | 27 | 4 | 20 | 83 | 3 | 3 | 29 | 2 | 83 | .251 | .308 | .478 | .786 | 7 | 8 | 6 | |
| DH | Paul Molitor | 36 | 111 | 501 | 437 | 88 | 142 | 213 | 19 | 2 | 16 | 73 | 17 | 3 | 58 | 45 | .325 | .404 | .487 | .891 | 8 | 2 | 1 | 3 | |
| UT | Darnell Coles | 31 | 45 | 149 | 130 | 18 | 32 | 44 | 4 | 1 | 2 | 16 | 1 | 15 | 16 | .246 | .324 | .338 | .663 | 3 | 1 | 1 | 2 | ||
| OF | Turner Ward | 28 | 32 | 82 | 72 | 5 | 13 | 25 | 1 | 1 | 3 | 28 | 1 | 8 | 1 | 12 | .181 | .272 | .347 | .619 | 2 | 1 | 1 | ||
| RF | Darrin Jackson | 29 | 46 | 189 | 176 | 15 | 38 | 61 | 8 | 5 | 19 | 2 | 8 | 53 | .216 | .250 | .347 | .597 | 9 | 5 | |||||
| SS | Dick Schofield | 30 | 30 | 105 | 90 | 11 | 19 | 24 | 1 | 2 | 5 | 3 | 14 | 23 | .211 | .317 | .267 | .584 | 1 | 1 | |||||
| C | Randy Knorr | 24 | 27 | 77 | 70 | 6 | 11 | 23 | 1 | 1 | 3 | 9 | 6 | 24 | .157 | .224 | .329 | .552 | 2 | 1 | |||||
| SS | Alfredo Griffin | 35 | 30 | 75 | 71 | 9 | 17 | 20 | 3 | 3 | 2 | 7 | .239 | .260 | .282 | .542 | 2 | 2 | |||||||
| Team Totals | 112 | 4433 | 3941 | 584 | 1089 | 1710 | 215 | 32 | 114 | 565 | 101 | 38 | 388 | 36 | 620 | .276 | .344 | .434 | .778 | 100 | 38 | 34 | 32 |
1993 Blue Jays Season-Ending Stats
| Pos | Name | Age | G | PA | AB | R | H | TB | 2B | 3B | HR | RBI | SB | CS | BB | IBB | SO | BA | OBP | SLG | OPS | GDP | HBP | SH | SF |
|---|---|---|---|---|---|---|---|---|---|---|---|---|---|---|---|---|---|---|---|---|---|---|---|---|---|
| C | Pat Borders | 30 | 138 | 520 | 488 | 38 | 124 | 181 | 30 | 9 | 55 | 2 | 2 | 20 | 2 | 66 | .254 | .285 | .371 | .656 | 18 | 2 | 7 | 3 | |
| 1B | John Olerud | 24 | 158 | 679 | 551 | 109 | 200 | 330 | 54 | 2 | 24 | 107 | 2 | 114 | 33 | 65 | .363 | .473 | .599 | 1.072 | 12 | 7 | 7 | ||
| 2B | Roberto Alomar | 25 | 153 | 683 | 589 | 109 | 192 | 290 | 35 | 6 | 17 | 93 | 55 | 15 | 80 | 5 | 67 | .326 | .408 | .492 | .900 | 13 | 5 | 4 | 5 |
| SS | Tony Fernandez | 31 | 94 | 390 | 353 | 45 | 108 | 156 | 18 | 9 | 4 | 50 | 15 | 8 | 31 | 3 | 26 | .306 | .361 | .442 | .803 | 13 | 5 | 1 | |
| 3B | Ed Sprague | 25 | 150 | 596 | 546 | 50 | 142 | 211 | 31 | 1 | 12 | 73 | 1 | 32 | 1 | 85 | .260 | .310 | .386 | .696 | 23 | 10 | 2 | 6 | |
| LF | Rickey Henderson | 34 | 44 | 203 | 163 | 37 | 35 | 52 | 3 | 1 | 4 | 12 | 22 | 2 | 35 | 1 | 19 | .215 | .356 | .319 | .675 | 1 | 2 | 1 | 2 |
| CF | Devon White# | 30 | 146 | 668 | 598 | 116 | 163 | 262 | 42 | 6 | 15 | 52 | 34 | 4 | 57 | 1 | 127 | .273 | .341 | .438 | .779 | 3 | 7 | 3 | 3 |
| RF | Joe Carter | 33 | 155 | 669 | 603 | 92 | 153 | 295 | 33 | 5 | 33 | 121 | 8 | 3 | 47 | 5 | 113 | .254 | .312 | .489 | .802 | 10 | 9 | 10 | |
| DH | Paul Molitor | 36 | 160 | 725 | 636 | 121 | 211 | 324 | 37 | 5 | 22 | 111 | 22 | 4 | 77 | 3 | 71 | .332 | .402 | .509 | .911 | 13 | 3 | 1 | 8 |
| UT | Darnell Coles | 31 | 64 | 217 | 194 | 26 | 49 | 72 | 9 | 1 | 4 | 26 | 1 | 1 | 16 | 1 | 29 | .253 | .319 | .371 | .691 | 3 | 4 | 1 | 2 |
| OF | Turner Ward# | 28 | 72 | 198 | 167 | 20 | 32 | 52 | 4 | 2 | 4 | 28 | 3 | 3 | 23 | 2 | 26 | .192 | .287 | .311 | .599 | 7 | 1 | 3 | 4 |
| RF | Darrin Jackson | 29 | 46 | 189 | 176 | 15 | 38 | 61 | 8 | 5 | 19 | 2 | 8 | 53 | .216 | .250 | .347 | .597 | 9 | 5 | |||||
| SS | Dick Schofield | 30 | 36 | 128 | 110 | 11 | 21 | 26 | 1 | 2 | 5 | 3 | 16 | 25 | .191 | .294 | .236 | .530 | 1 | 2 | |||||
| C | Randy Knorr | 24 | 39 | 112 | 101 | 11 | 25 | 44 | 3 | 2 | 4 | 20 | 9 | 29 | .248 | .309 | .436 | .745 | 2 | 2 | |||||
| SS | Alfredo Griffin | 35 | 46 | 102 | 95 | 15 | 20 | 23 | 3 | 3 | 3 | 13 | .211 | .235 | .242 | .477 | 3 | 4 | |||||||
| Team Totals | 162 | 6319 | 5579 | 847 | 1556 | 2434 | 317 | 42 | 159 | 796 | 170 | 49 | 588 | 57 | 861 | .279 | .350 | .436 | .786 | 138 | 52 | 46 | 54 |